Dashboards
Keep the numbers you look at often on a dashboard of cards, look through it by dates and filters, and share it with your team.
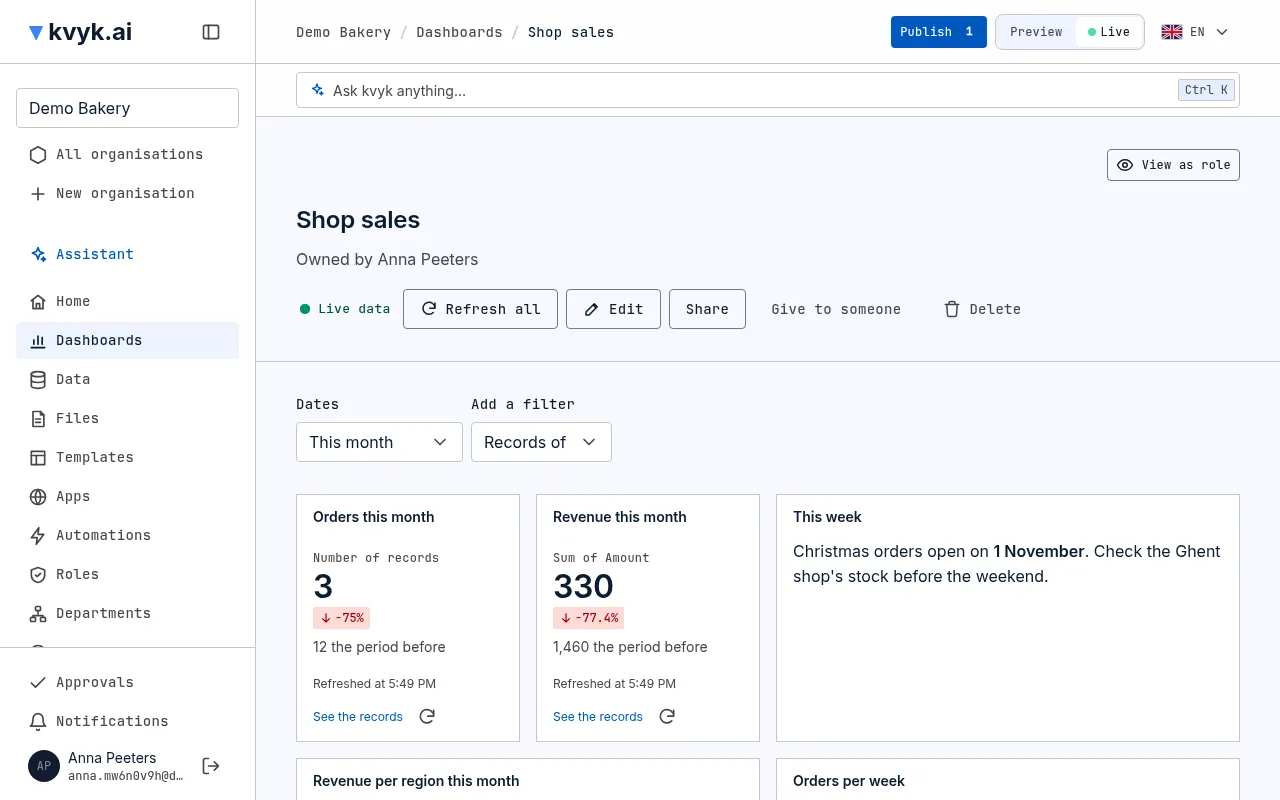
A dashboard keeps the numbers you look at often in one place: orders this month, revenue per region, stock running low. Each card on it answers one question about your records, as a number, a bar chart, a line chart, a table or a piece of text.
Everyone sees the numbers their own access allows. Two people opening the same dashboard can see different totals, because each card counts only the records that person may see (see Roles and access).
Open and make a dashboard
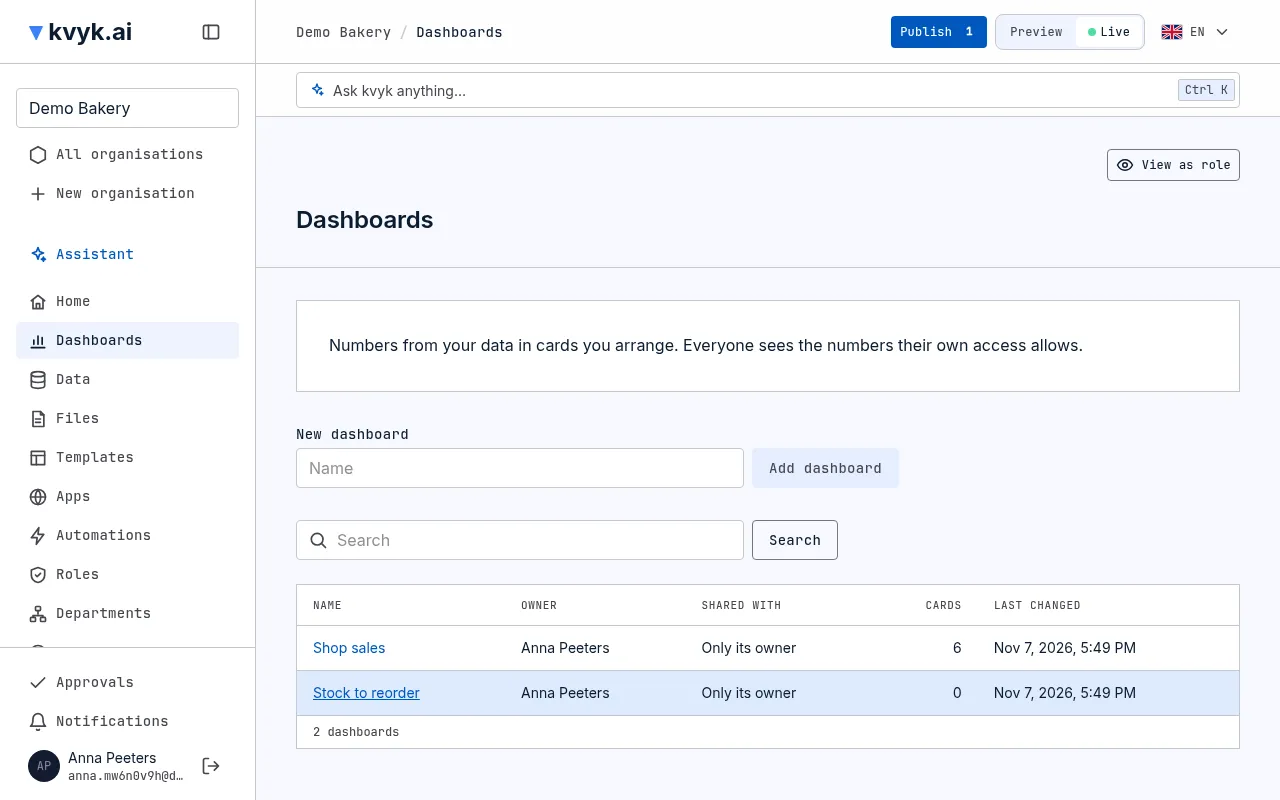
Section titled “Open and make a dashboard”Dashboards in the menu lists the dashboards you may open: your own, those shared with you, and for Administrators every one. Search them by name or owner; choose one to open it.
To make one, type its name under New dashboard and choose Add dashboard. Every member can make dashboards. A new dashboard is yours alone until you share it.
A dashboard opens on Live, with your real records. Switch to Preview to see it with your test records; it is the same dashboard on both, and you never publish it. A card that asks about a field or entity Preview does not have says so on its own; the other cards are unaffected.
Arrange the cards
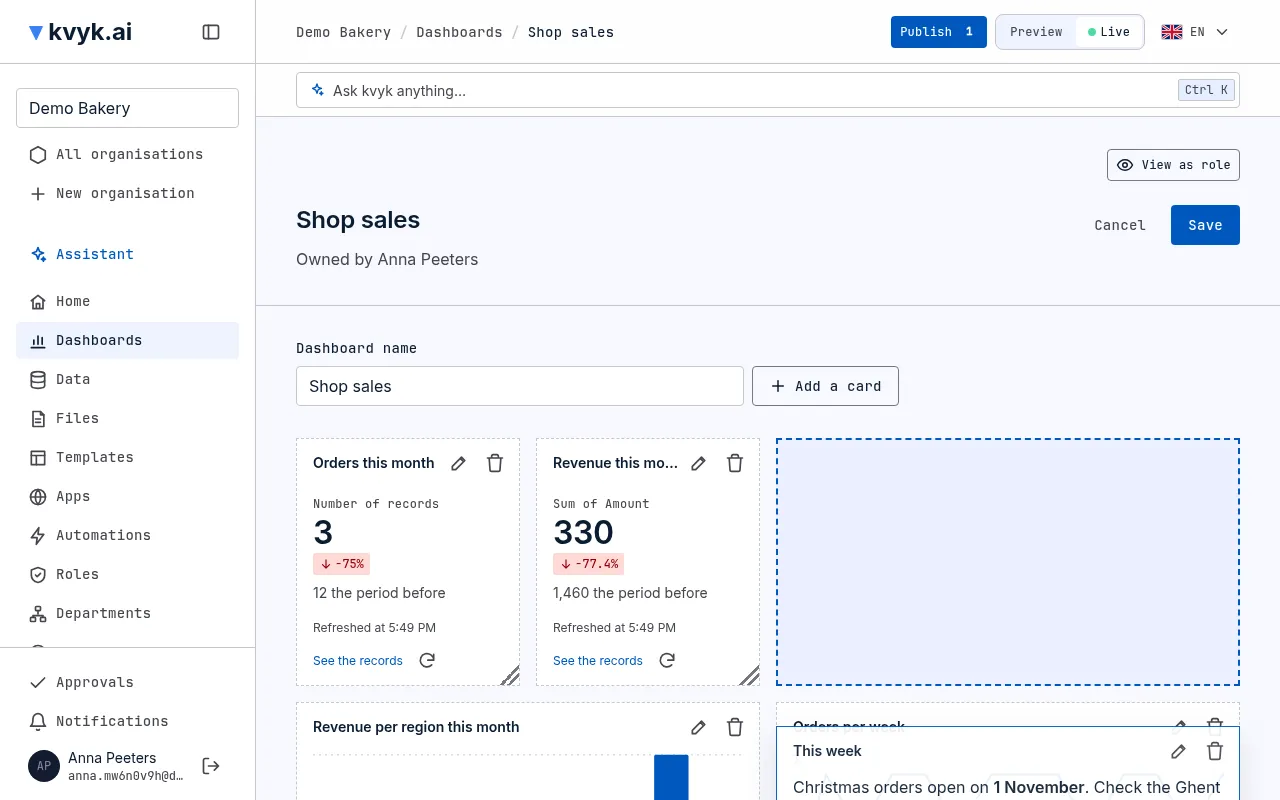
Section titled “Arrange the cards”The owner of a dashboard and Administrators can change it. Choose Edit:
- Move a card by dragging its title, and resize it by dragging its bottom right corner. The other cards make way.
- With a card selected, the arrow keys move it, and Shift with the arrow keys resizes it.
- Add a card opens the card editor for a new card; the pencil on a card opens it for that card; the × removes it.
- Change the dashboard’s name at the top.
Choose Save to keep everything at once, or Cancel to leave it as it was. If someone else saved the dashboard while you were changing it, you are asked to Load the latest and make your change again, so nobody’s work is lost.
A dashboard holds up to 24 cards. Arranging cards needs a wider screen: on a phone the cards stack one under the other and Edit is not shown.
The card editor
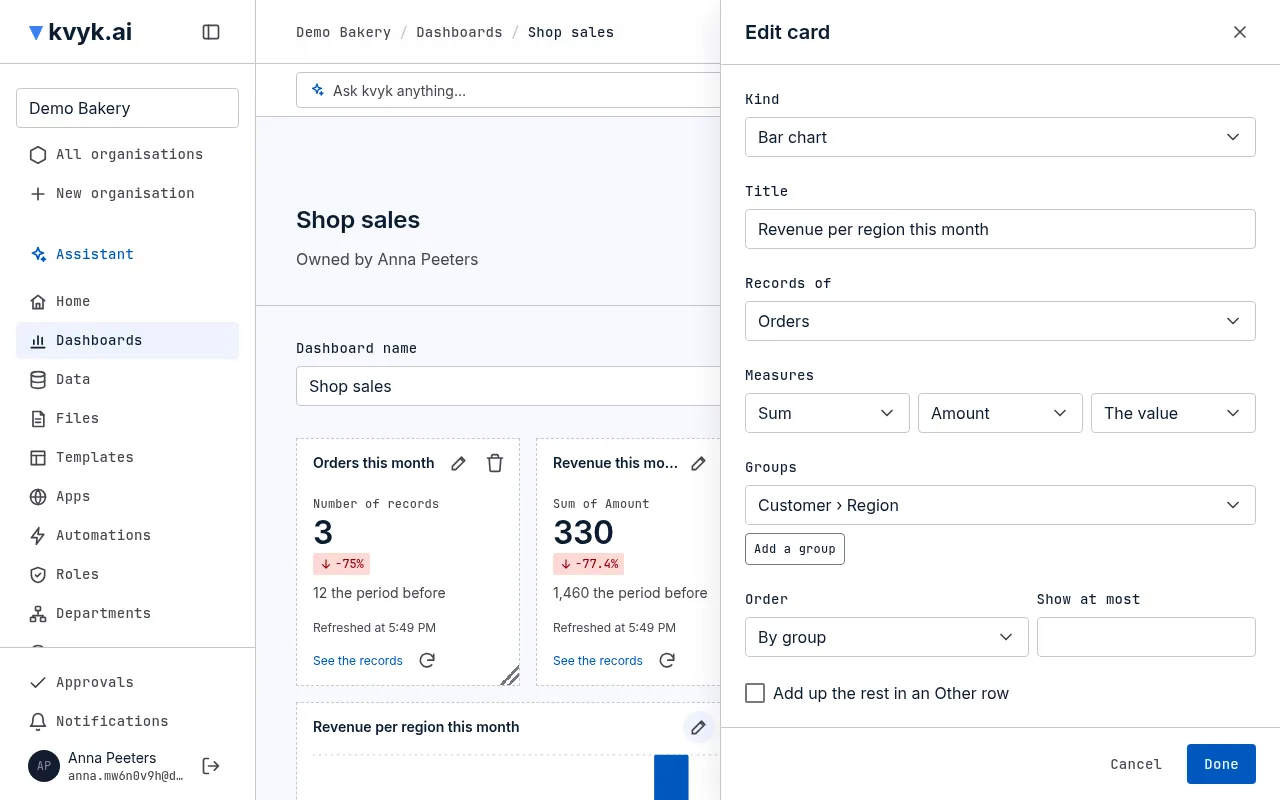
Section titled “The card editor”The card editor opens beside the dashboard, with a Preview of the card as you change it.
- Kind: what the card shows.
- Number: one number, such as the number of orders. Tick Compare with the period before to see how much it went up or down.
- Bar chart: a value per group, such as orders per region. A second group stacks the bars, such as orders per region and per status. Tick Bars lying down for long names.
- Line chart: a value over time, such as orders per week.
- Table: up to three groups and five measures in rows and columns.
- Text: a title and text of your own, for a heading or a note. It understands Markdown: headings, lists, links and tables.
- Title: what the card is called on the dashboard.
- Records of: the entity it counts, such as Orders.
- Measures: what it calculates: the Number of records, the Number of different values, or the Sum, Average, Lowest or Highest of a number field. Show as turns it into a Percent of the total or a Running total.
- Groups: what it splits the records by, such as Region, or a field of a linked record, such as each order’s Customer › Region, or a many-to-many link, such as each product’s Ingredients: a record then counts in the group of every record it is linked to, so the groups can add up to more than the records. A link to people, such as each shift’s Volunteers, works the same way: a record counts in the group of every person in it. A date groups Per day, week, month or year.
- Order and Show at most: which groups come first and how many are shown. Add up the rest in an Other row keeps the total right when not every group is shown.
- Dates apply to: the date field the dashboard’s dates hold this card to. Choose No dates for a card the dates should leave alone.
- Only records where: rules for this card only, such as Status is Active.
Choose Done to put the card on the dashboard, then Save.
Look through dates and filters
Section titled “Look through dates and filters”Above the cards, Dates narrows every card to a period: All time, the Last 7 days or Last 30 days, This month, Last month, This year, or Between dates you choose. Days count in your time zone.
Add a filter chooses an entity and a rule, as on a records page (see Find and export records). The rule holds every card on that entity, such as Orders: Region is Ghent.
Dates and filters change only what you see. The owner and Administrators can choose Keep for everyone, and everyone then opens the dashboard with them.
See the records behind a number
Section titled “See the records behind a number”Choose a bar, a point on a line or a table row to open the records it counts, already filtered, on the data page. See the records under a card opens all of them; on a card grouped by a many-to-many link or a link to people, it is the only way in. From there you can look at each one or export them.
Fresh numbers
Section titled “Fresh numbers”Each card loads its numbers when it comes into view, and says when they were Refreshed. Use the refresh button on a card, or Refresh all at the top, for the latest numbers. A card that takes too long or cannot be loaded says so, and the others carry on.
Share, give and delete
Section titled “Share, give and delete”The owner and Administrators can choose Share to decide who sees the dashboard:
- Only its owner, as a new dashboard starts.
- All members of the organisation.
- The members I choose: by data role, by department or by name.
Administrators always see every dashboard. Your customers and people outside the organisation never see dashboards.
When the owner leaves the organisation, the dashboard says so, and an Administrator can choose Give to someone to make another member its owner. Delete removes a dashboard for everyone, after you confirm it.
Making, changing, sharing and deleting a dashboard each shows in the event log.